Next: References Up: advalect2 Previous: Ford-Fulkerson method
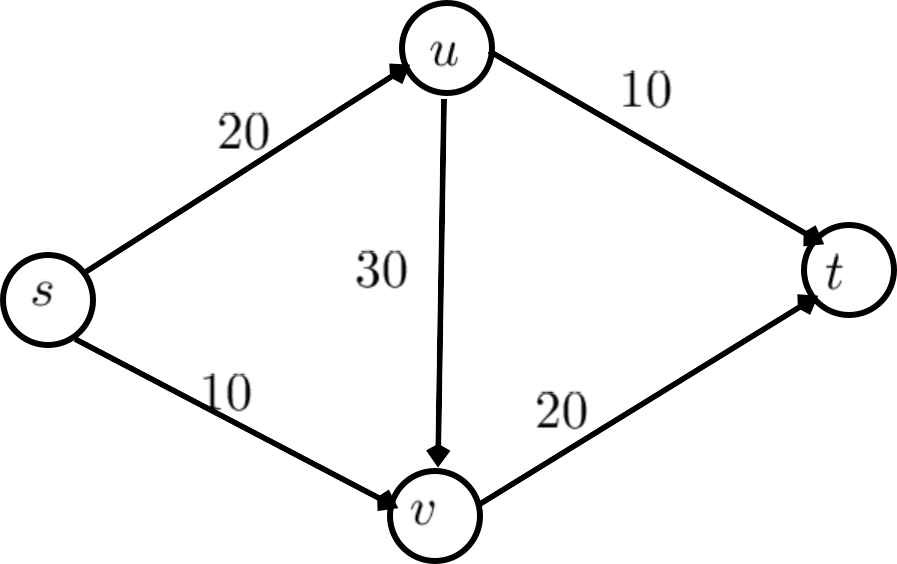
![[*]](crossref.png) find out the maximum flow. The weights given on edges are of maximum capacities of the edges.
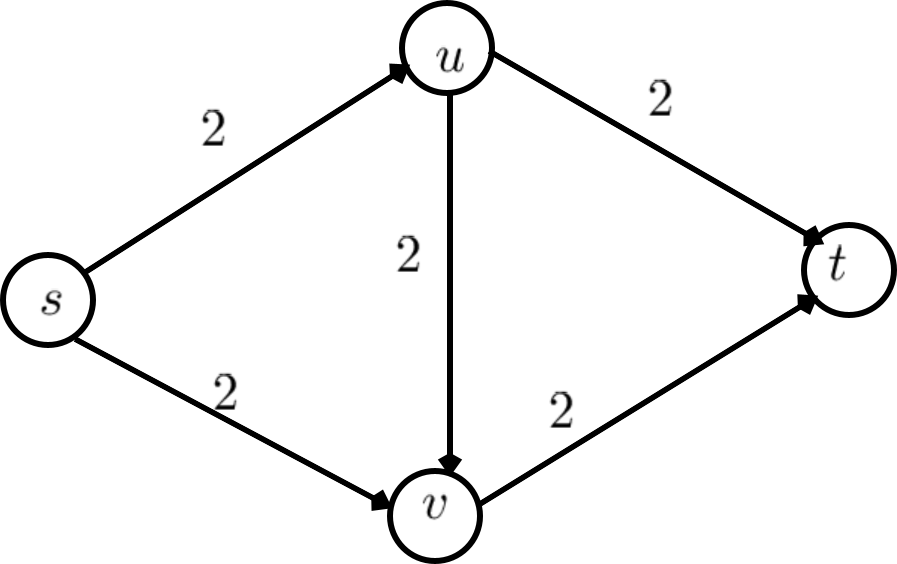
find out the maximum flow. The weights given on edges are of maximum capacities of the edges.
 -
- cuts in the flow network shown in figure .
- cut in the flow network shown in figure .
, answer the followings:
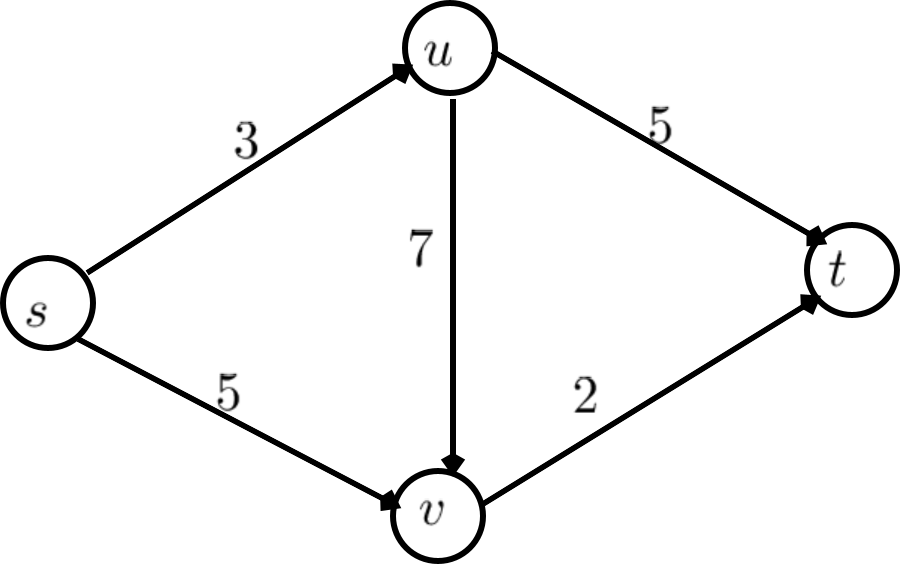
- flow in this graph? Justify.
- cut in this flow network.
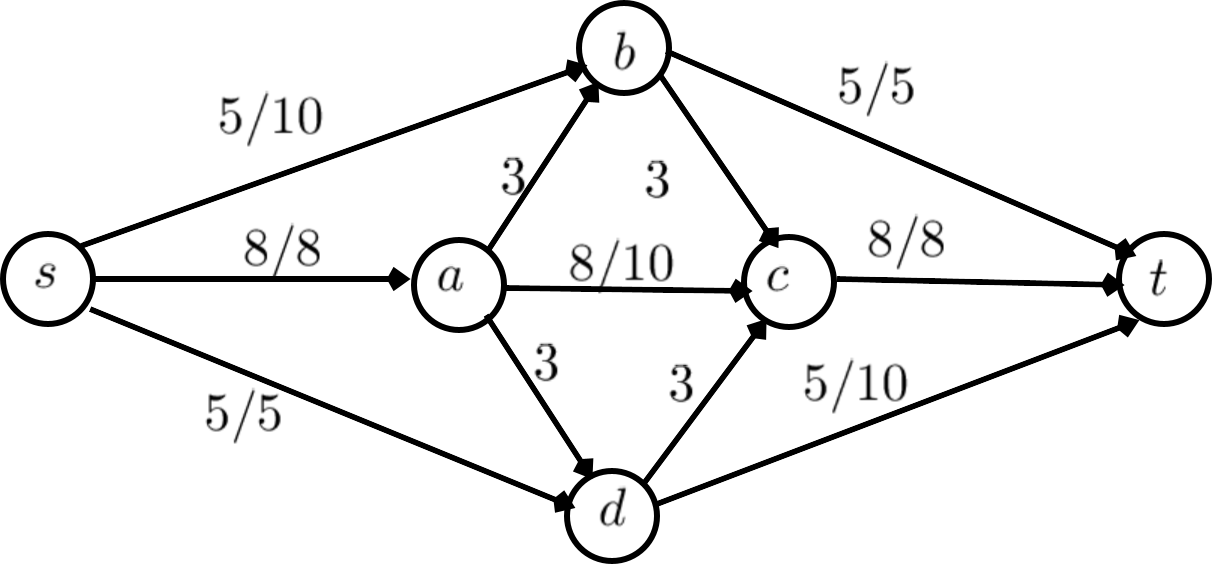
Note: In  ,
,  is flow and
  is capacity. In case of single value, it is flow.